Categories
Work

Sellers’ Dashboard @ Tradeshift

The project

After years of working heavily on delivering features and improve the experience on various points of the procurement process to its enterprise customers and connecting them to their supply chain, it was set a goal at Tradeshift to focus on the other end of such connections, the sellers.

The seller’s experience in Tradeshift was lacking some starting point, something that is a standard in similar web platforms. Our sellers needed a dashboard where they could easily get started and familiarized with the platform, have easy access to the most relevant information in their accounts, trigger key actions and find themselves around.

My role

As the UX/UI Designer, I was responsible for defining the user segments that this dashboard was going to be introduced to, understanding their user-journeys and each segment’s specific needs, building the journey maps, prioritize feature releases with the PM, testing prototypes with users, building the final layouts and syncing with frontend developers to get the designs developed as defined.

Duration

This project was started in January 2019 and the MVP was released in December 2019.

Background

Tradeshift is a cloud-based business-to-business network and platform for supply chain payments. As a network, buying companies that purchase Tradeshift’s solutions create their company’s and user accounts and invite their sellers to join the platform as well. This is done through onboarding campaigns, where sellers receive email invitations from their buyers to go through the account creation process in Tradeshift, with the goal to exchange documents, product catalogs, and more.

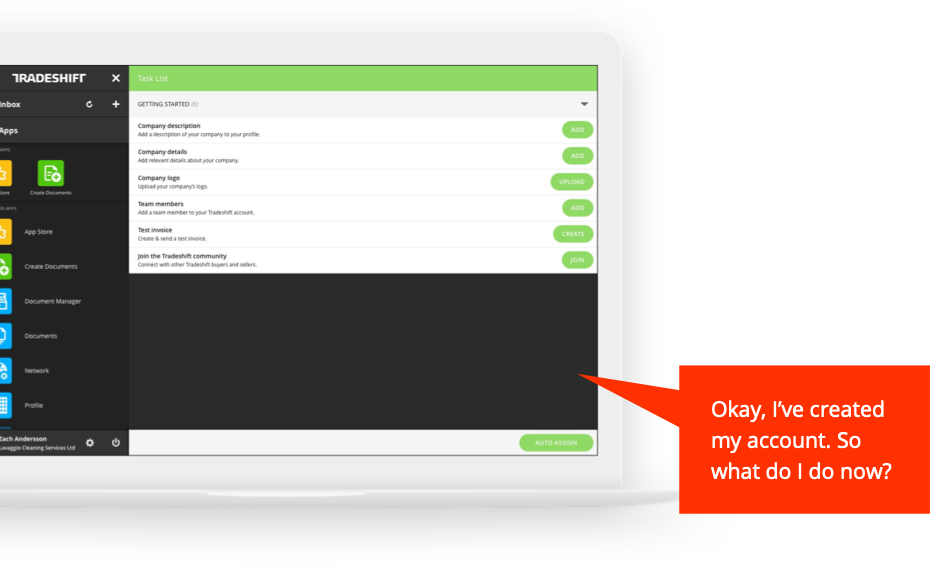
The previous user experience for sellers was disjointed, confusing, and lacking in direction. Sellers created their accounts and found themselves on the platform with little guidance about what they should do, how to achieve the goals they need to achieve, and solve the tasks they joined the platform to solve. The platform contains an enormous and ever-growing number of apps and functionalities, all of which are given the same weight to any given user and increase the confusion and lack of focus.
Understanding the problem

The first thing that needed to be done was to understand who were these sellers using Tradeshift’s platform.

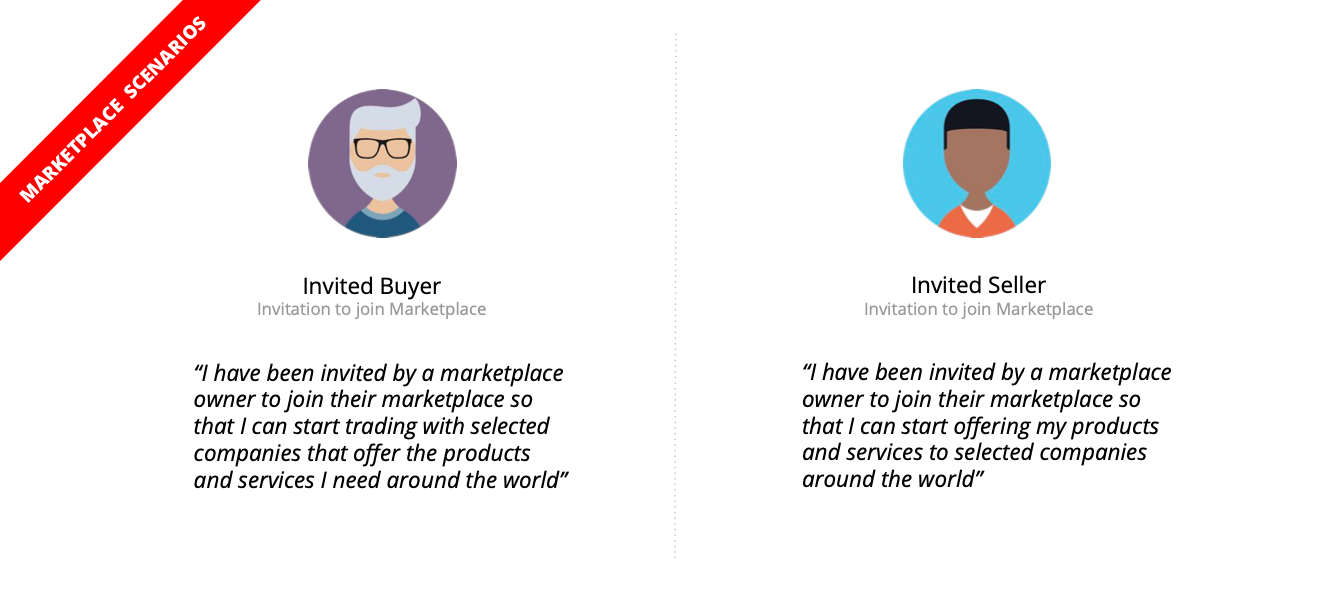
Combining research studies conducted by the UX research team with knowledge spread around the company – with various Product Managers, customer-facing teams, and designers involved in the various products that Tradeshift develops, I’ve put together some basic scenarios for the multiple kinds of operations sellers could perform on the platform.
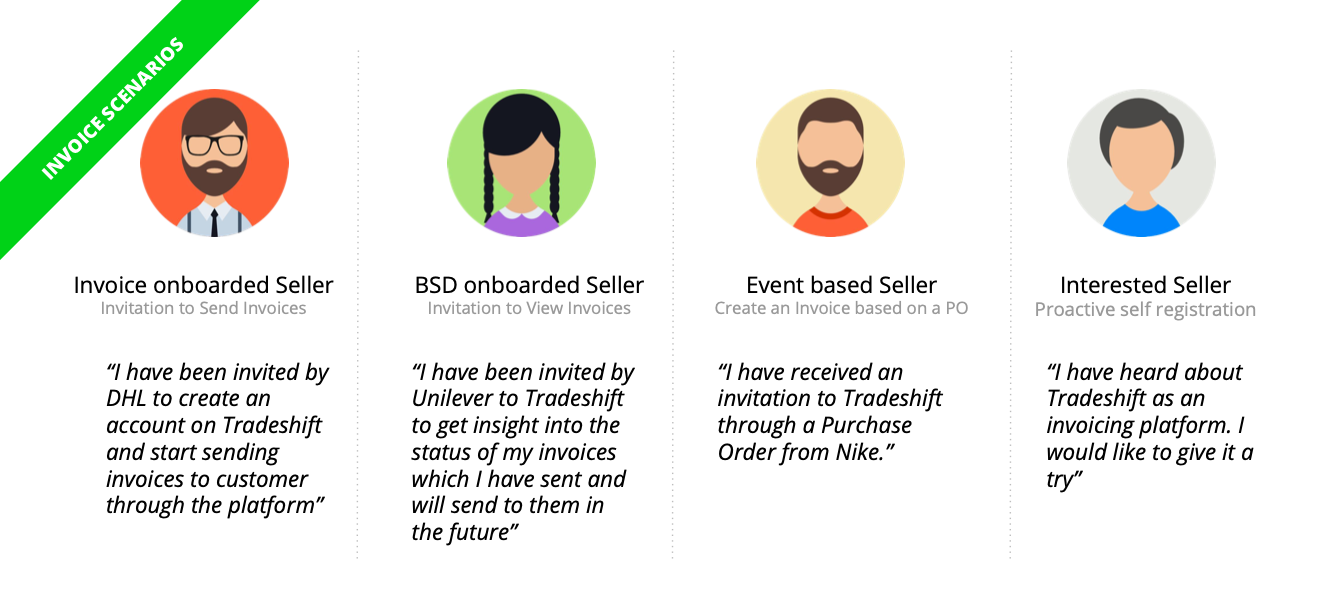
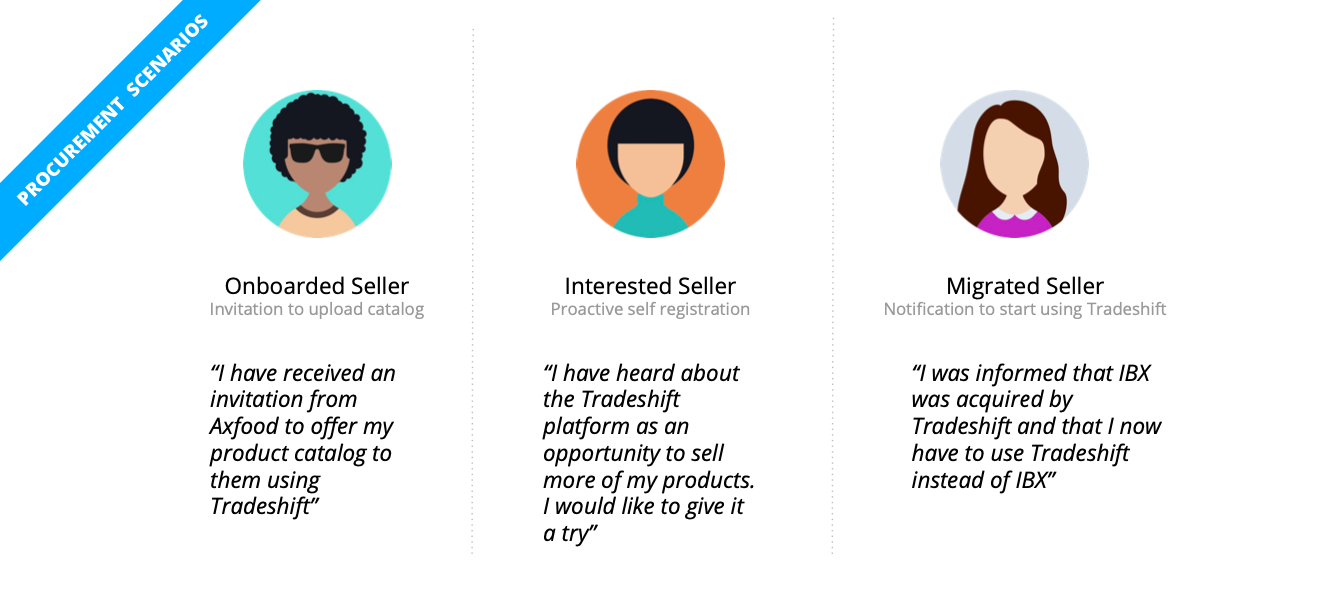
BSD stands for Buyer Sourced Data

For each of these scenarios, I’ve worked with the relevant stakeholders to identify the users’ journeys, apps used in the platform, onboarding needs, most relevant data, and common actions.

First concept, journeys & steps
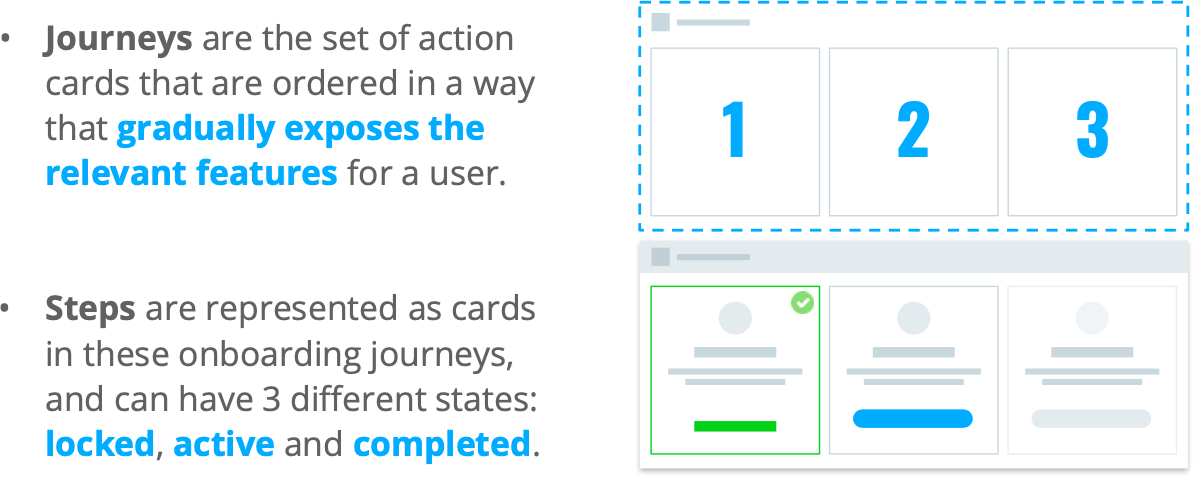
The first idea that was explored was to tie down the sellers’ initial onboarding needs in a guided experience, right after their account creation.

This led to the creation of a document with the main actions these sellers should take to get started with the products they need to use.

For all the scenarios, I also designed a user-journey flow, with which later discussions could be held with the stakeholders.

High-level seller onboarding flow for the Marketplace scenario

Simplify the onboarding, focus on operations

Tradeshift’s platform was heavily built after its corporate customers’ specific needs. There is a huge effort by professional services teams to make for the documents traded to be handled correctly within the procurement systems these companies have in place, and campaigns for onboarding their suppliers. This means that though we tried to push for consistent and simple actions for the sellers to connect with their buyers and start sending/receiving documents, there was a technical barrier to this plug-and-play approach we first envisioned. The idea was put aside at that time.

That led to the decision of focusing on the suppliers already using the platform and those being onboarded through campaigns.

The journeys and steps gave place to a simple dashboard introduction modal, a reminder to add missing information, and a modular operational dashboard.

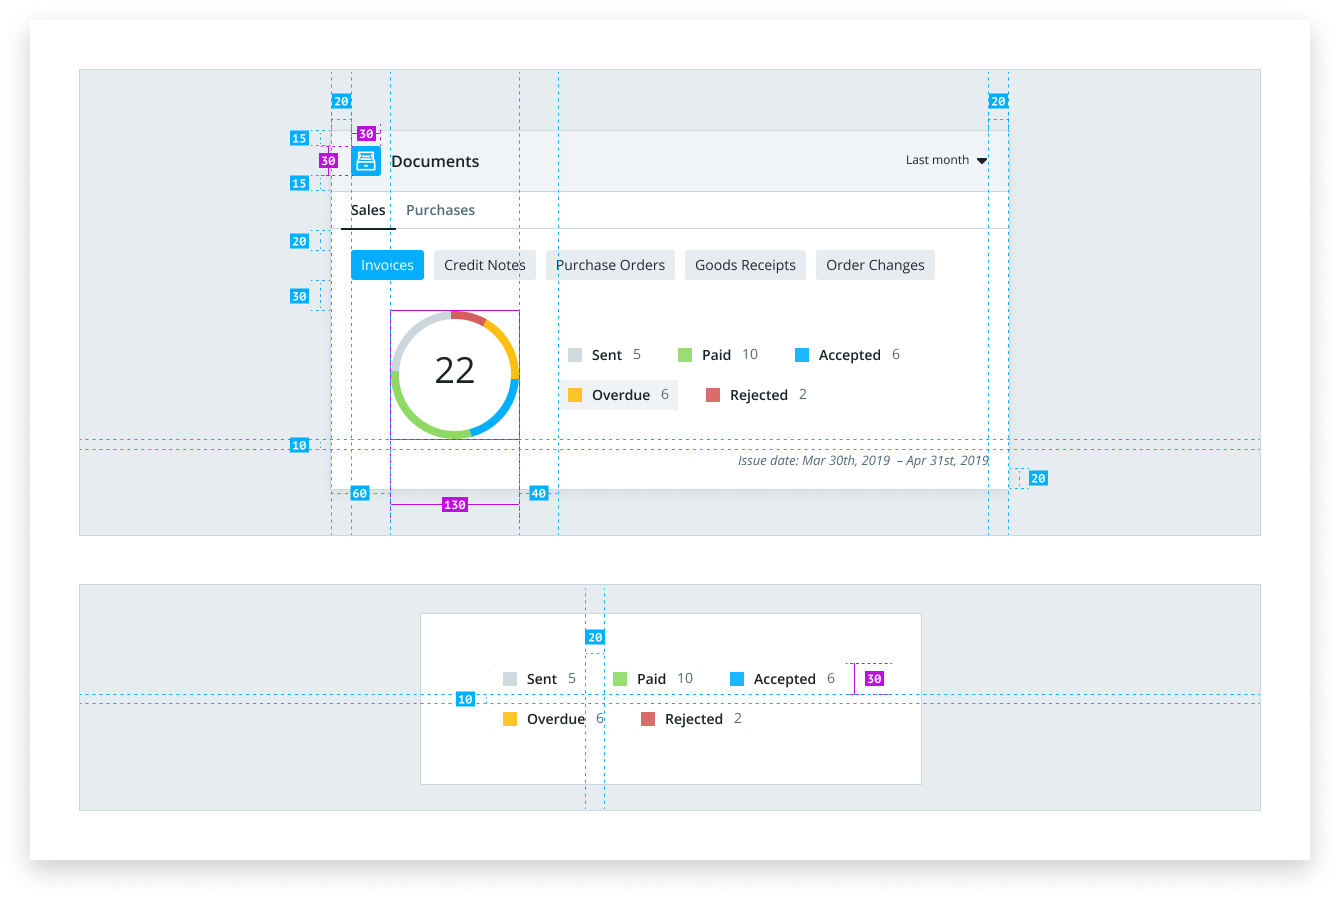
Main widgets UI documentation

Here is part of the UI documentation shared with frontend developers.
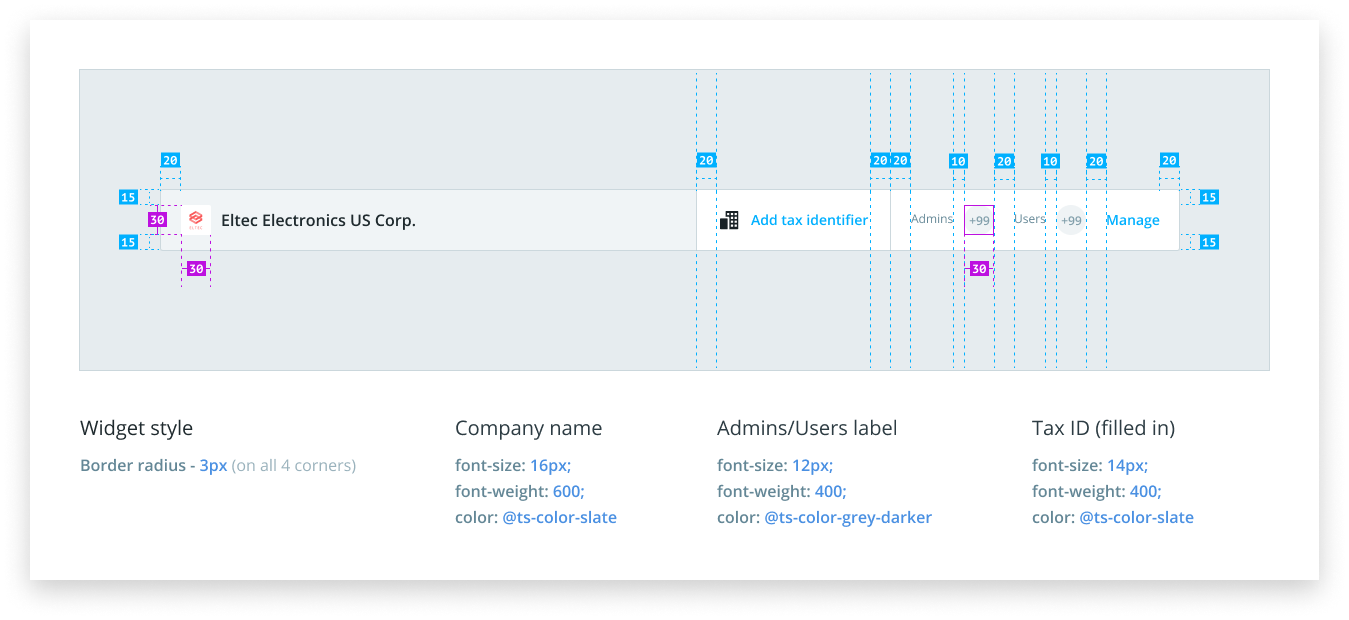
Dashboard release

The new dashboard was introduced both to new sellers joining the platform and those already using it.

Intro modal – highlighting the benefits sellers will get from the new dashboard
Intermediate screen – request for sellers to complete their company’s profile information
Complete company profile
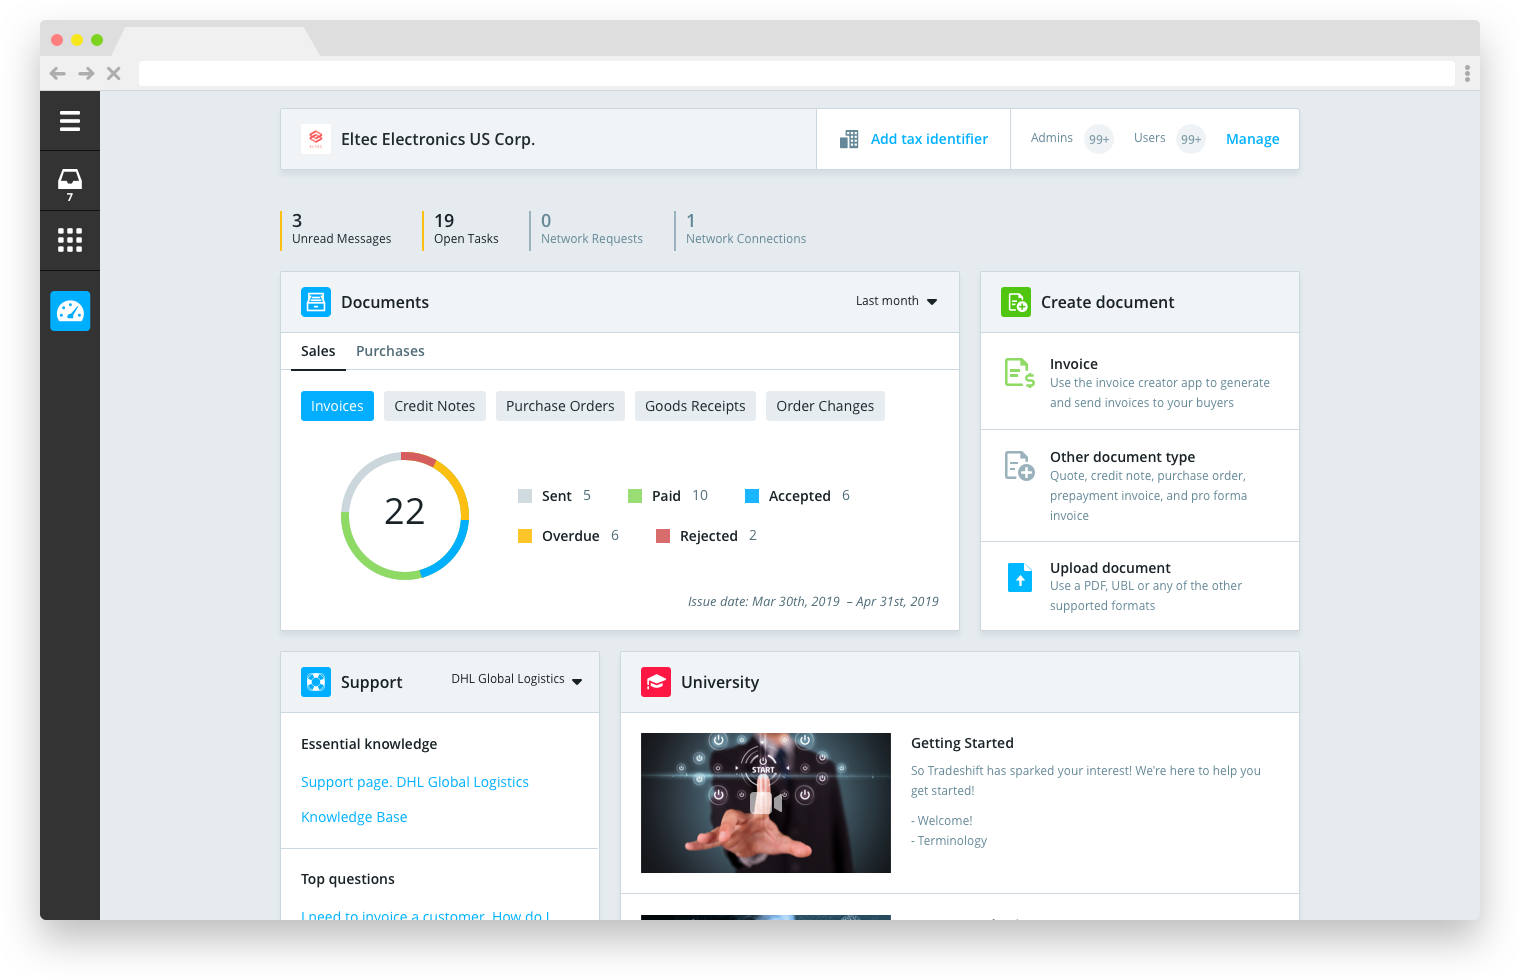
Initial state of the seller’s dashboard. Here the seller would have quick access to the most recent documents, notifications, quick actions. access to their company profile (and user management), highlights from Tradeshift’s knowledge base, and personalised trainings available to that user.
Populated dashboard

Upcoming – Dashboard conversion and new widgets

An important aspect of this dashboard release was to introduce the use of metrics to check its adoption rate by existing sellers, validate the hypothesis that a simplified onboarding process would increase the conversion rate of new sellers, and whether or not providing easier access to their documents would increase these documents’ processing time.

The modular nature of the dashboard, together with the newly introduced metrics, also allowed quick testing of new widgets that could speed up other processes that sellers could perform in the platform.

I left Tradeshift right after the release of the Seller’s Dashboard release, though. So I didn’t get the chance to view this data.

If you want to check if Tradeshift can improve you company’s procurement processes and see the Seller’s Dashboard live, you can do so at go.tradeshift.com

Categories
Work

Performance email @ Admatic

The project

The idea of proactive communication through periodic performance reports came up in a moment when Admatic had a strategy of automating processes both internal and for end-users. The technology team was migrating the application from a monolith to microservices and creating APIs to achieve these goals. It brought the opportunity to create a new service for providing email communication to the customers with information about the conversion of their integrations with multiple channels.

My role

As the UX/Product Designer, I was responsible for defining the information that would be provided to the clients alongside the support and technology agents, structure the presentation of this data, generate the layouts and define the KRs and how to validate them.

Duration

This was a quick project that took place between October and November 2016.

Gathering the information

After a meeting by product, technology and support agents to define which data would be presented to the end-users, the backend dev team planned the strategy to gather this data and serve it to the frontend via API.

Sketching

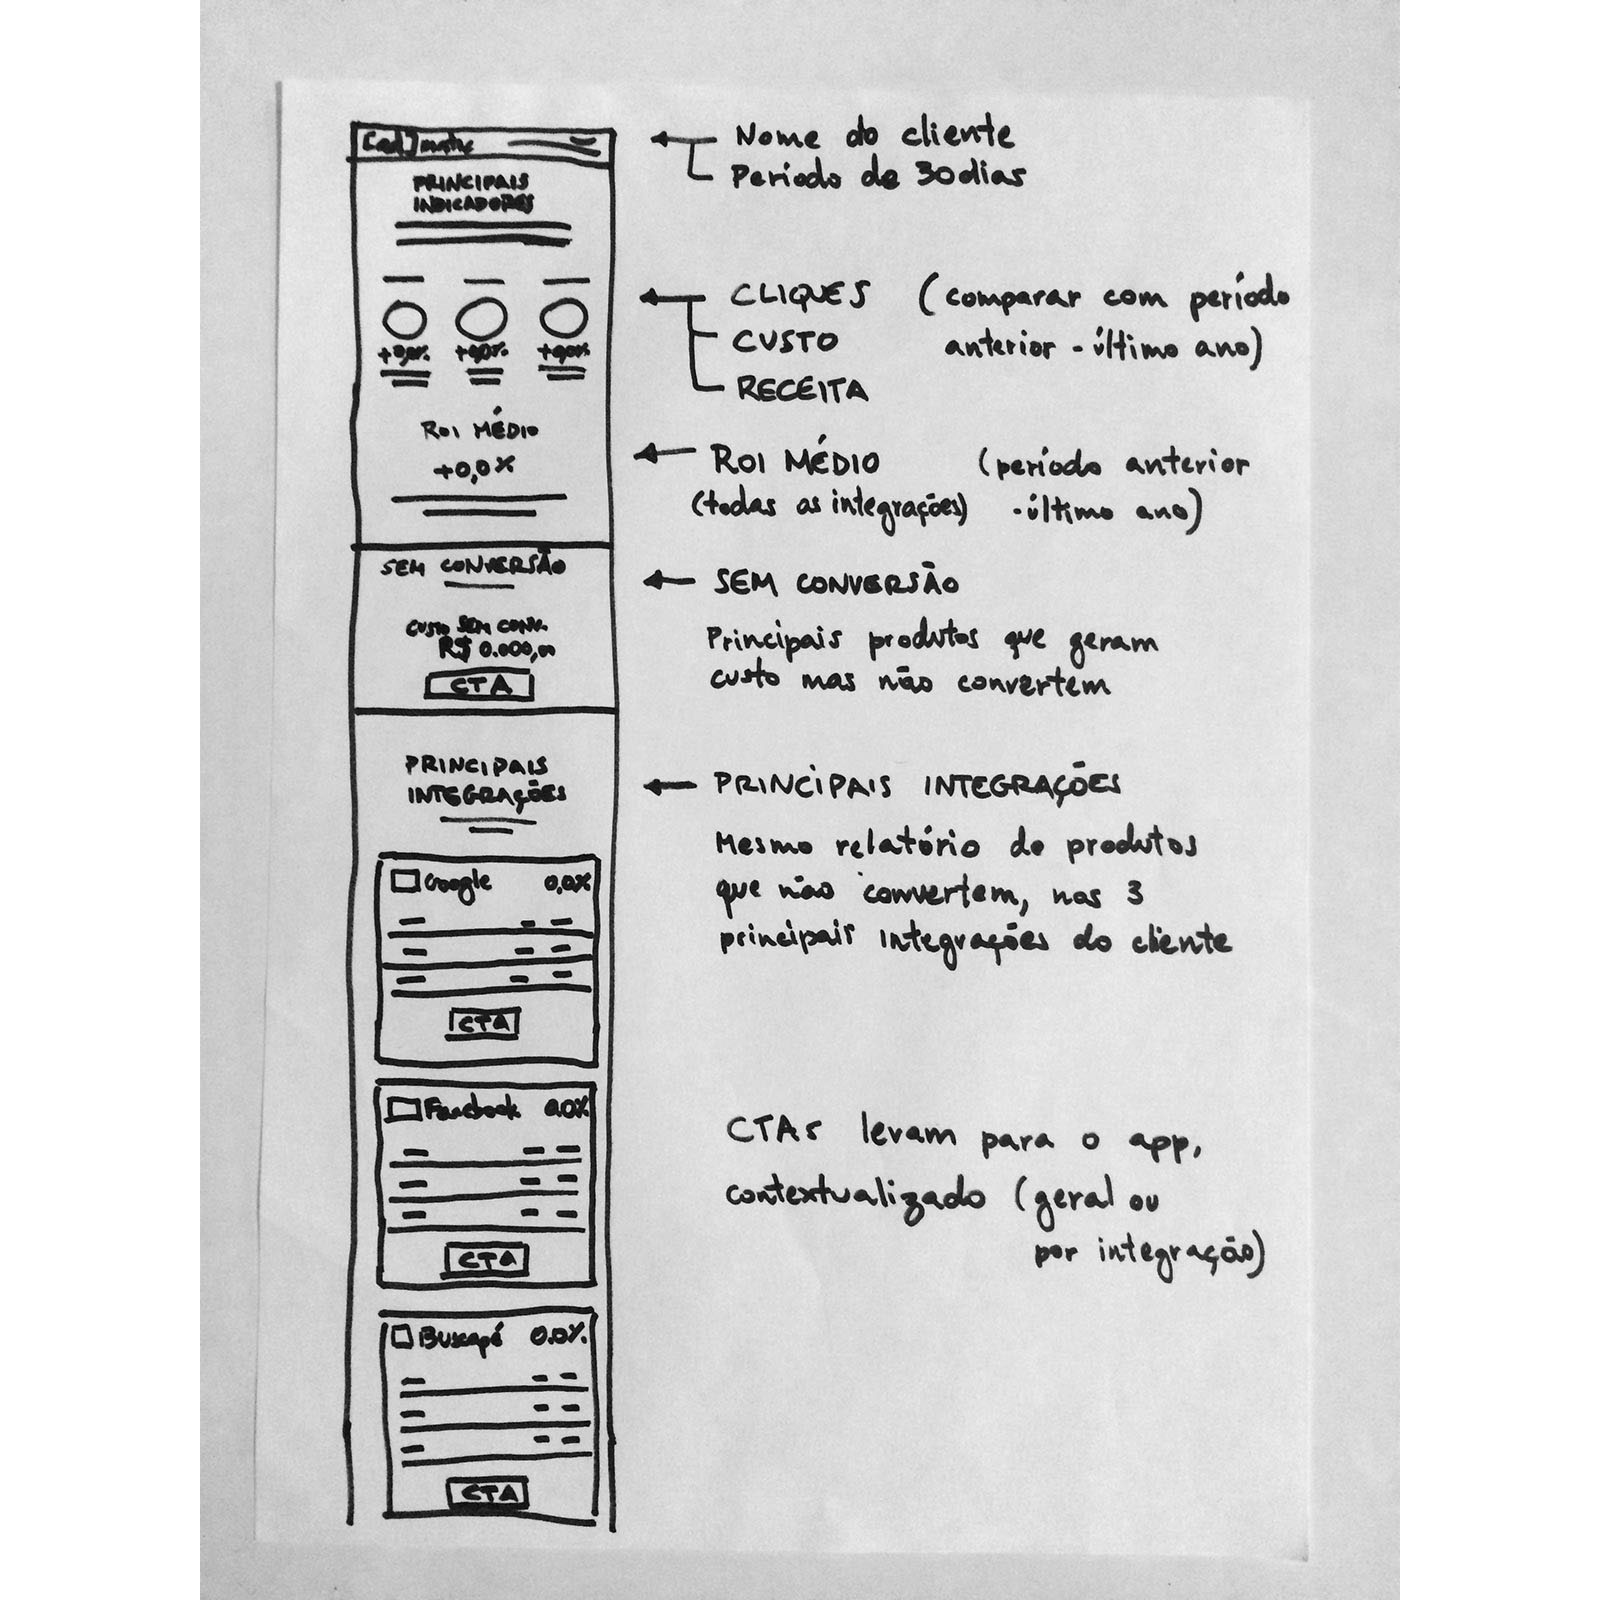
Together with the team, I went through a sketch session in which a wireframe that would guide the final designs was produced.

Agreed information to be included in the report
  • Header with customer’s company name + branding
  • Data extracted from the previous 30 days
  • Main performance indicators (Clicks – Cost – Revenue) for the period & comparison with the same period in the previous year
  • Average ROI for all integrations
  • No conversion – Main products generating cost but not converting
  • Main integrations – Same data on products not converting, broken down by the customer’s main integrations
  • CTAs take the customer to the Admatic, filtered by context – General or by integration

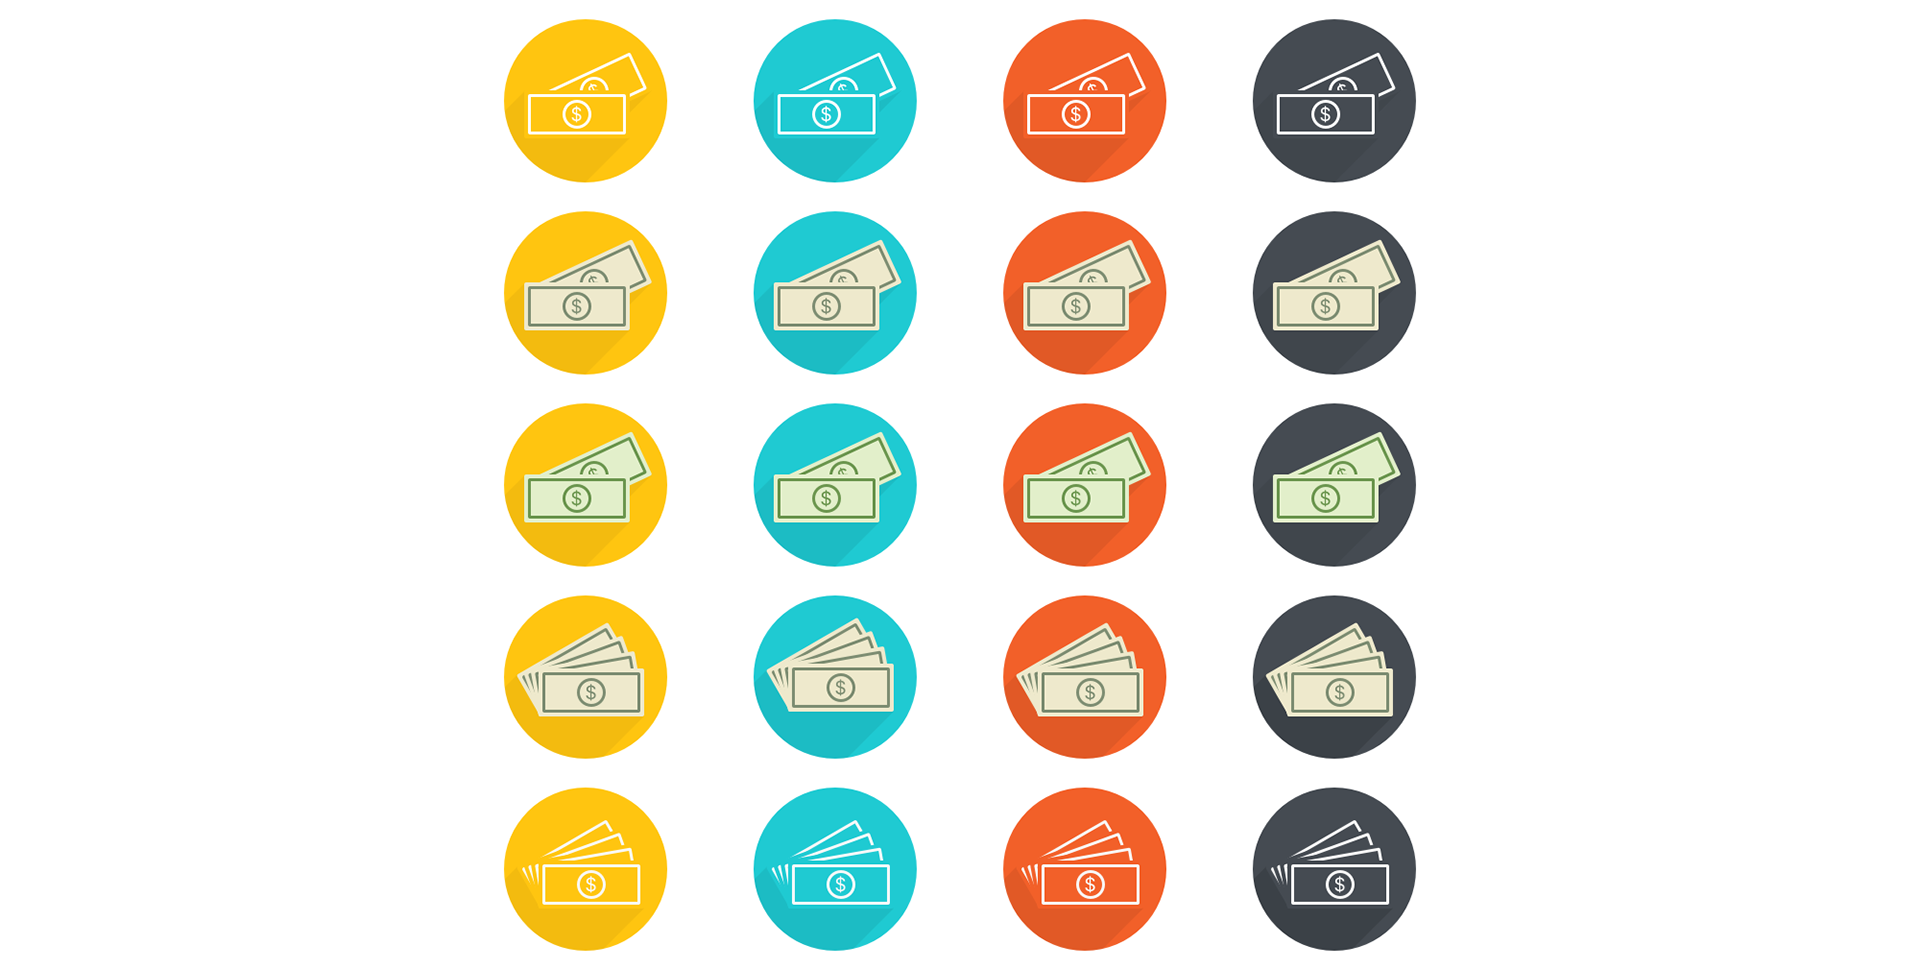
Iconography

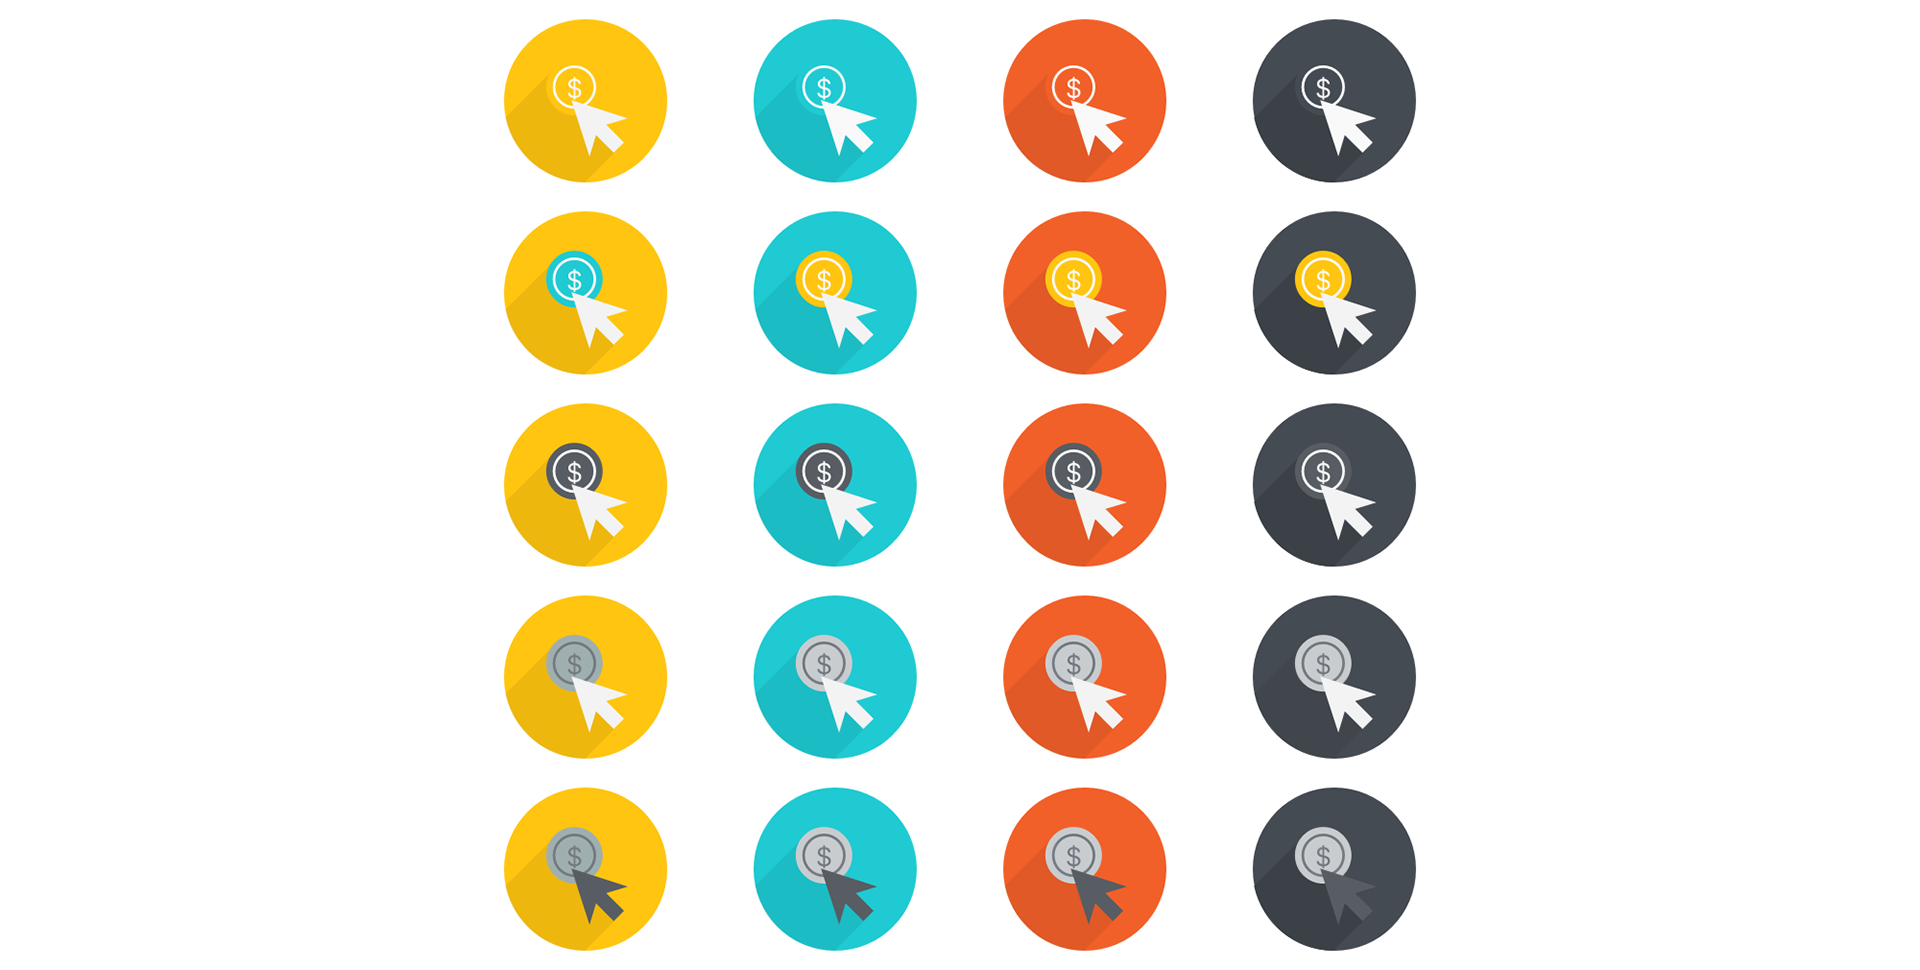
Quick studies made following the design guidelines I have set in agreement with the managers for creating a more relatable and friendly communication with the customers.

Cliques (number of clicks on the ads for all channels)
Custo (total cost of the campaign)
Receita (total revenue in the period)

Final layout

The email’s layout was finished following the wireframes previously produced, with some fine adjustments, again for getting a more relatable communication.

  • Dynamic textual summary of the data presented in each section of the report
  • Link to the platform’s knowledge base with curated content related to performance improvements and automation of campaigns
Categories
Work

Book Collections @ Estante Virtual

The project

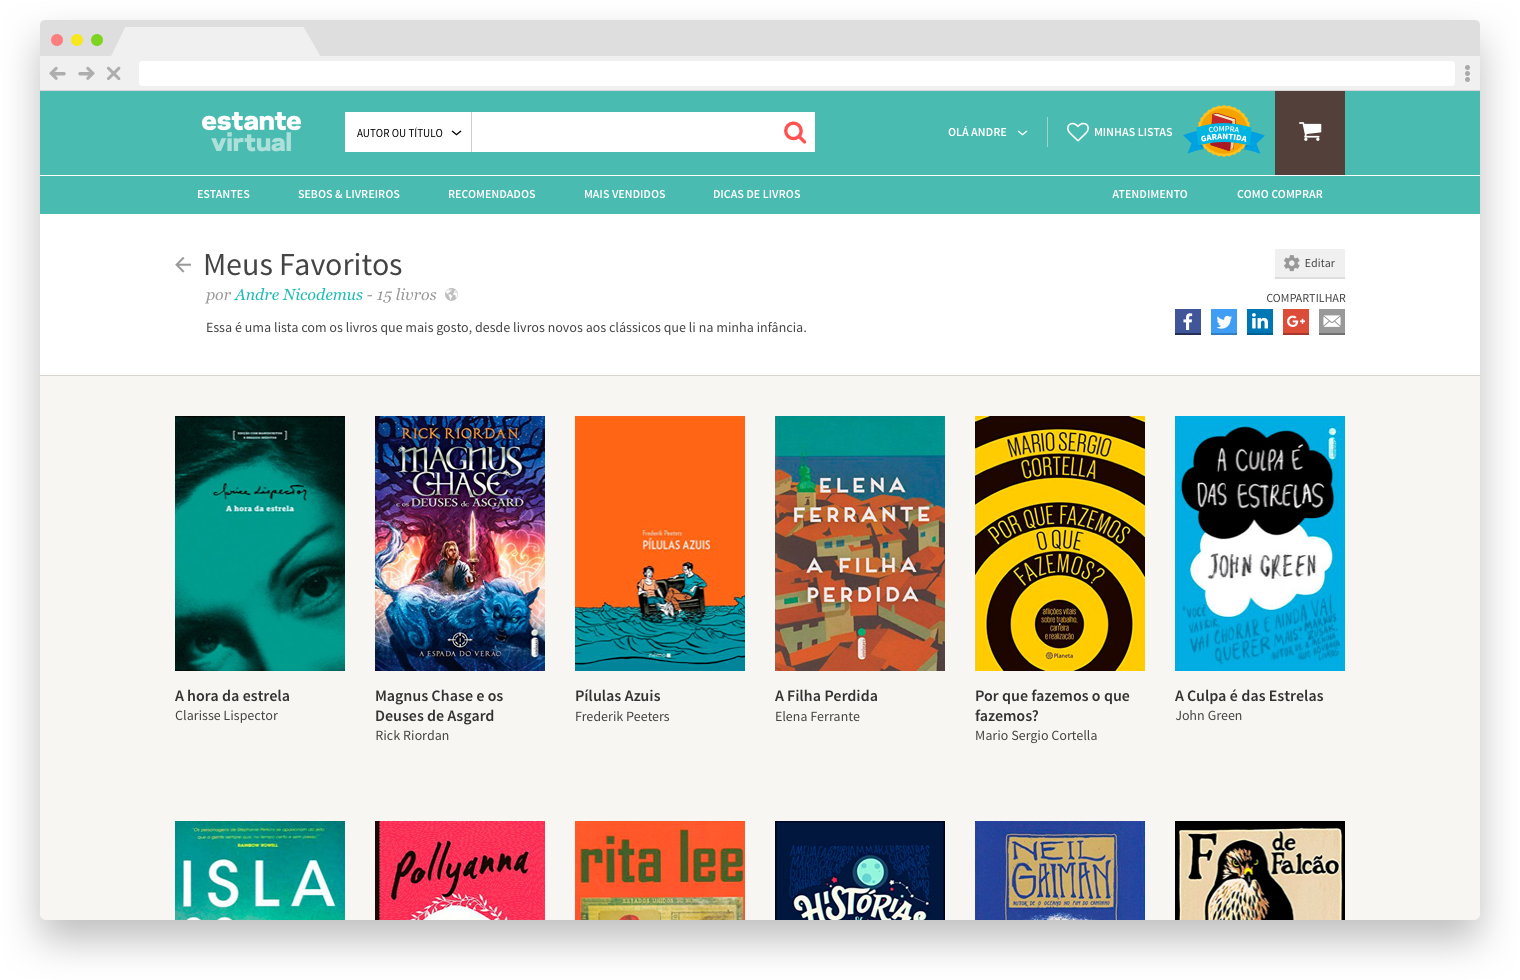
This project’s kickoff was the joining of a marketing strategy opportunity and the need to attenuate a usability and business model struggle, based on our personas. On one hand, the upcoming college semester presented a nice opportunity to introduce a feature that enables teachers, students, and institutions to create collections – also known as listas in Portuguese – of required books. On the other hand, book lovers and buyers would now be able to create as many collections as they want pinning the actual book and not a specific copy of it. 

My role

As the UX/Product Designer, I was responsible for defining the information that would be provided to the clients alongside the support and technology agents, structuring the presentation of this data, generating the layouts, and defining the KRs and how to validate them.

Duration

This project took place between May and July 2017.

The sketches

After the background research and benchmarking, a quick process including people from product, design, and development led to the definition of prioritized features and very simple wireframes.

Simple wireframes with the main features and their release priority (releases 1 and 2) 

Prototyping

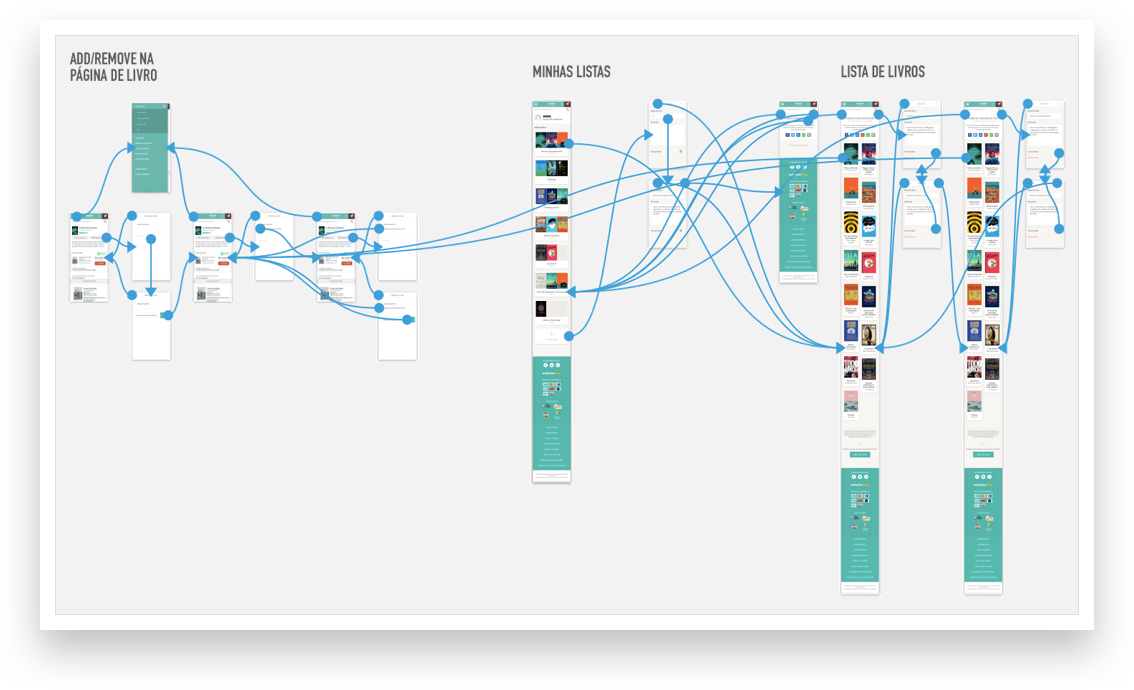
The user flow prototypes were created directly on Sketch App, using InVison’s Craft plugin.

MVP features

Excerpts from the mobile prototype. All the interactions were recorded directly on InVision’s viewer. 

Add book to a collection
View all collections from a user
Open collection

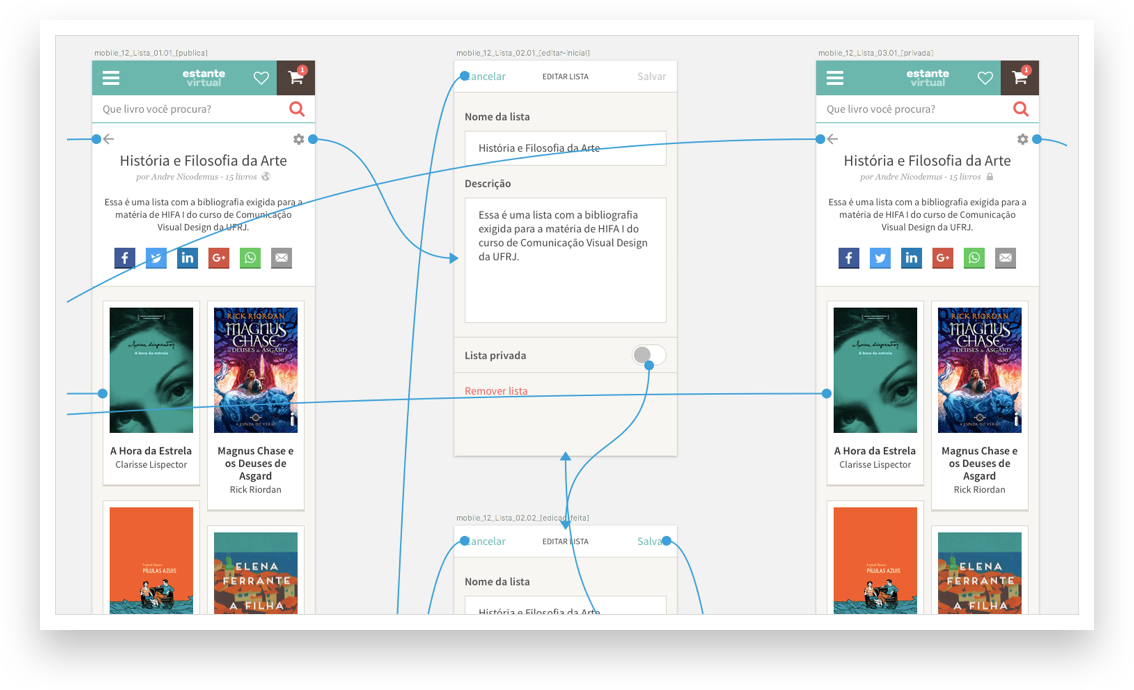
Second release features

Excerpts from the mobile prototype. All the interactions were recorded directly on InVision’s viewer. 

Edit or remove a collection
Create a new collection from the collections index

Responsive design details

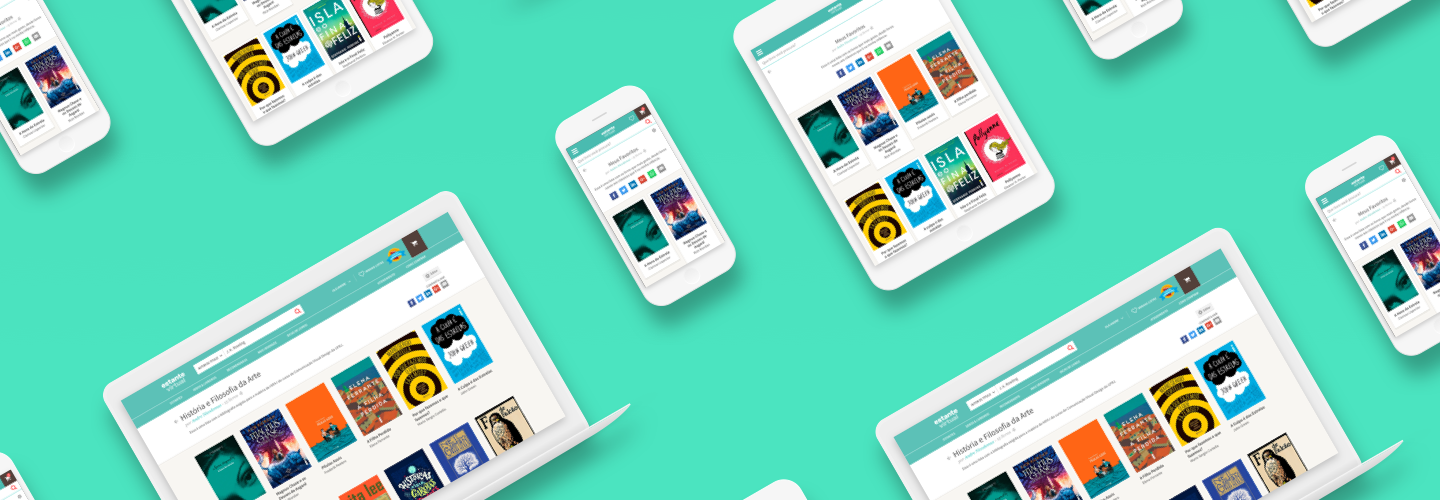
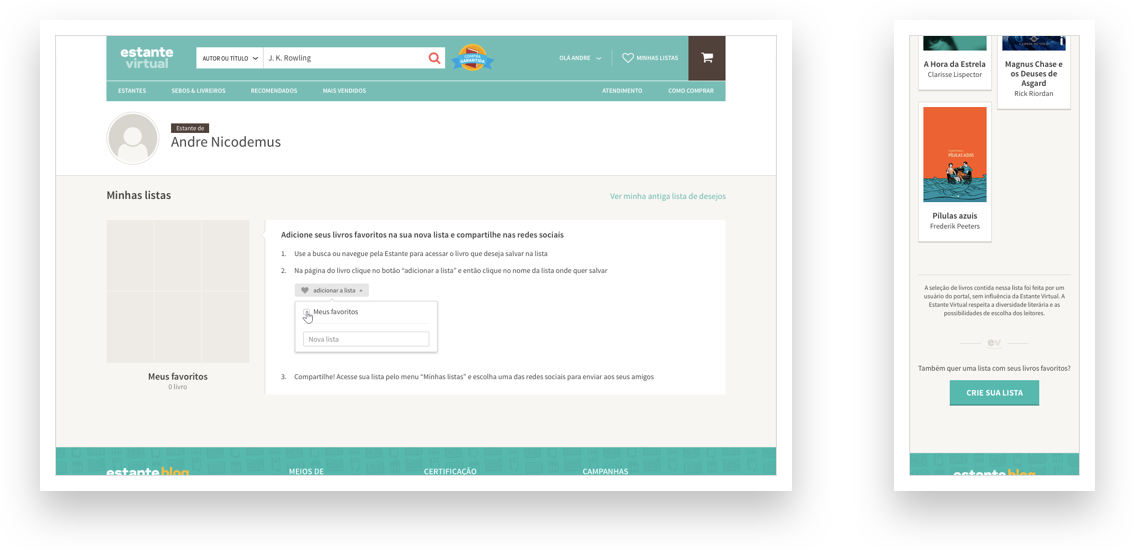
One of the project’s requirements was that all of the features fully work on both mobile devices and desktops. So the layouts were designed to adjust nicely through various screen resolutions.

Recording from the actual product after implementation.

Delivering and tweaking

After a public release with low investment in advertising, we noticed that the usage of the functionality was not optimal. Many users accessed their collections index, but only a few of them opened the collections themselves. Besides that, few books were added to the lists.

Based on that information, we decided to focus on implementing specific improvements. These included adding an on-page step-by-step guide for new users and incorporating a call-to-action button that directs users to create their own collection page. The call-to-action button was placed on the footers of other users’ collections.