The project
The idea of proactive communication through periodic performance reports came up in a moment when Admatic had a strategy of automating processes both internal and for end-users. The technology team was migrating the application from a monolith to microservices and creating APIs to achieve these goals. It brought the opportunity to create a new service for providing email communication to the customers with information about the conversion of their integrations with multiple channels.
My role
As the UX/Product Designer, I was responsible for defining the information that would be provided to the clients alongside the support and technology agents, structure the presentation of this data, generate the layouts and define the KRs and how to validate them.
Duration
This was a quick project that took place between October and November 2016.
Gathering the information
After a meeting by product, technology and support agents to define which data would be presented to the end-users, the backend dev team planned the strategy to gather this data and serve it to the frontend via API.
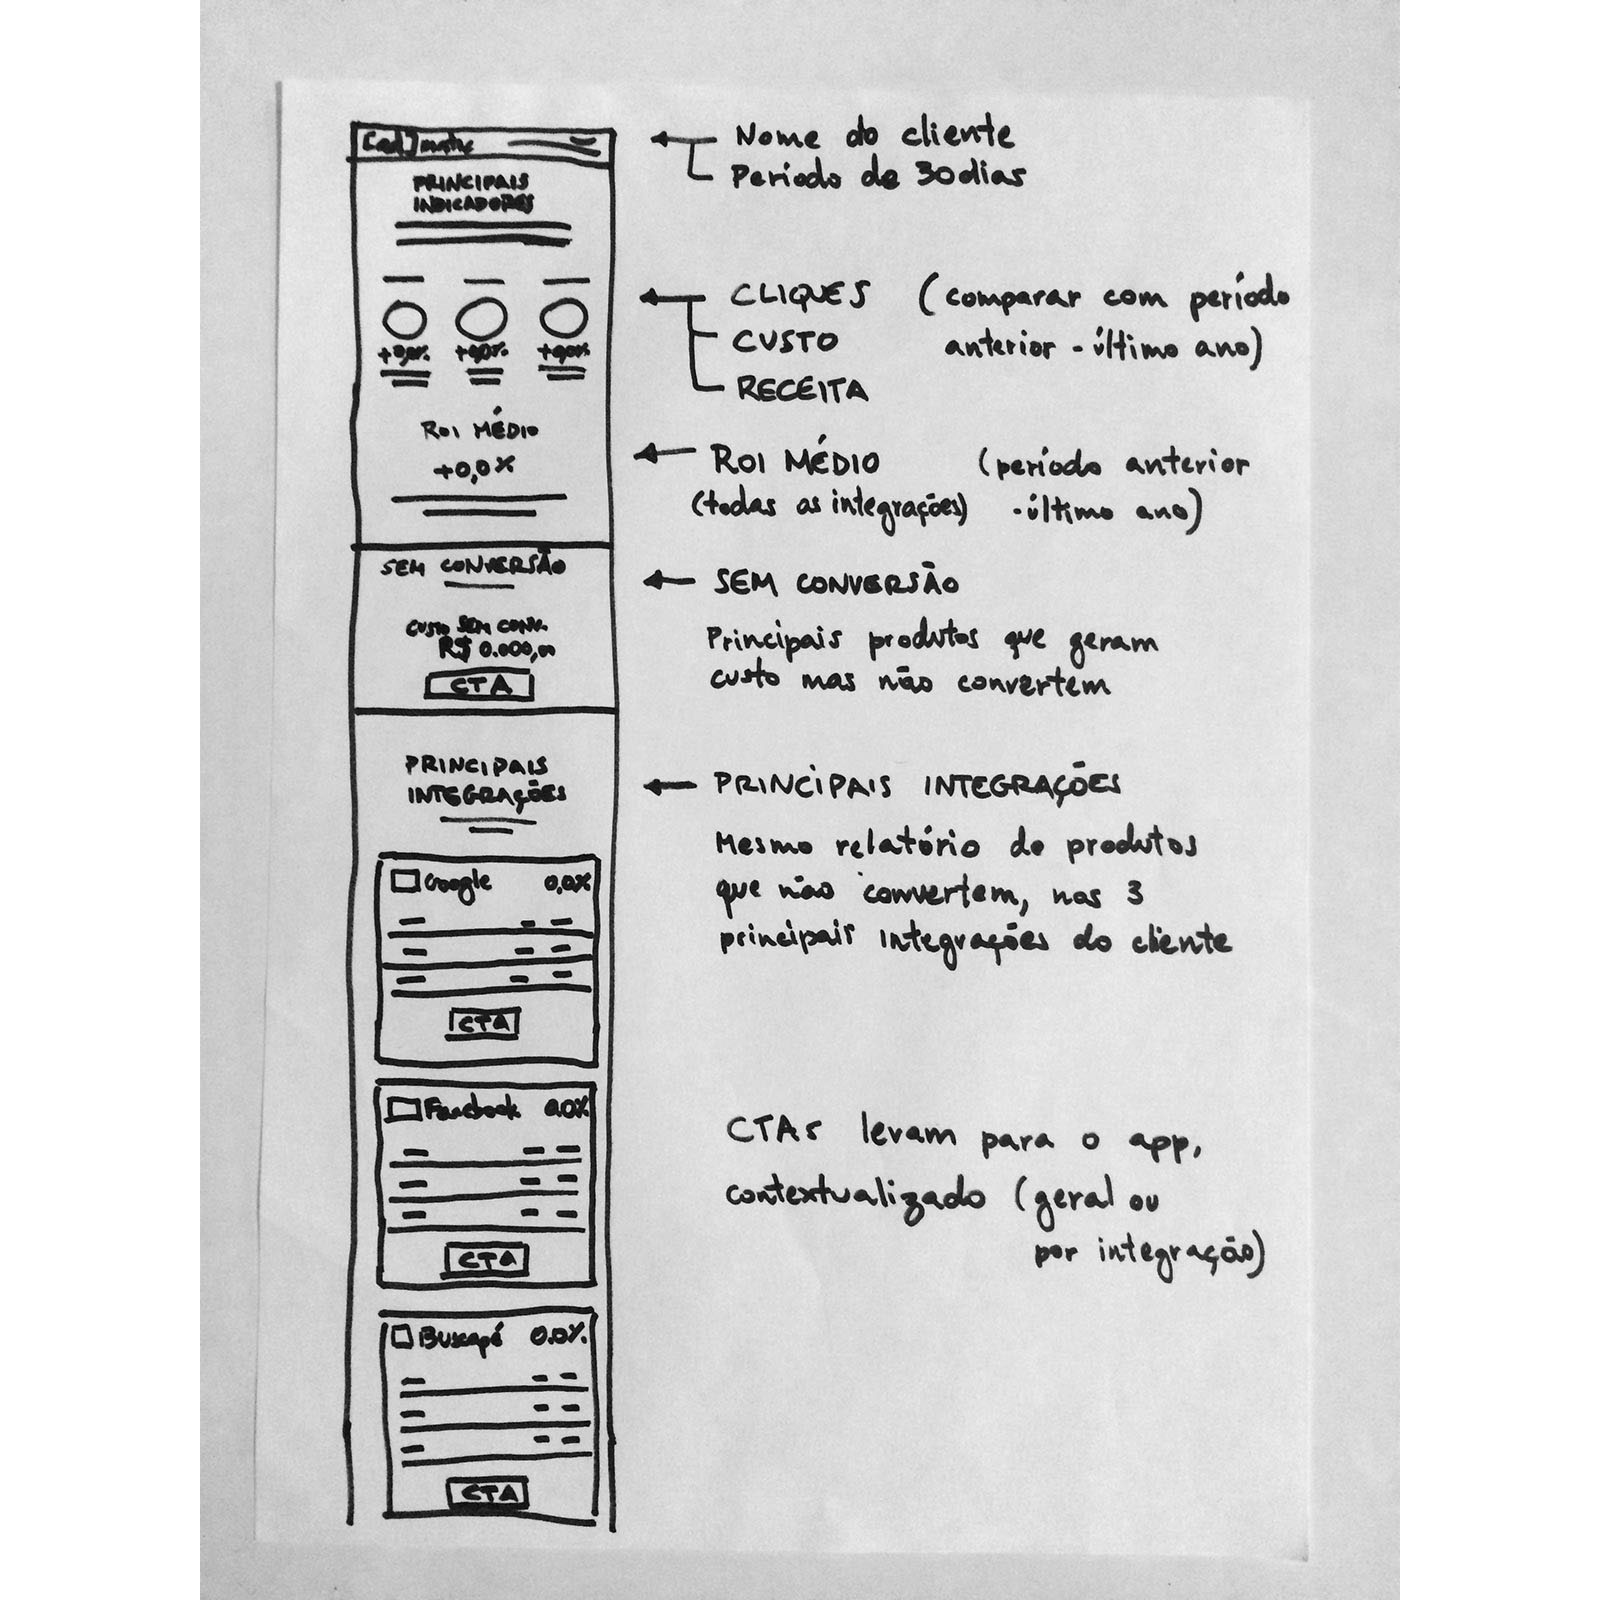
Sketching
Together with the team, I went through a sketch session in which a wireframe that would guide the final designs was produced.
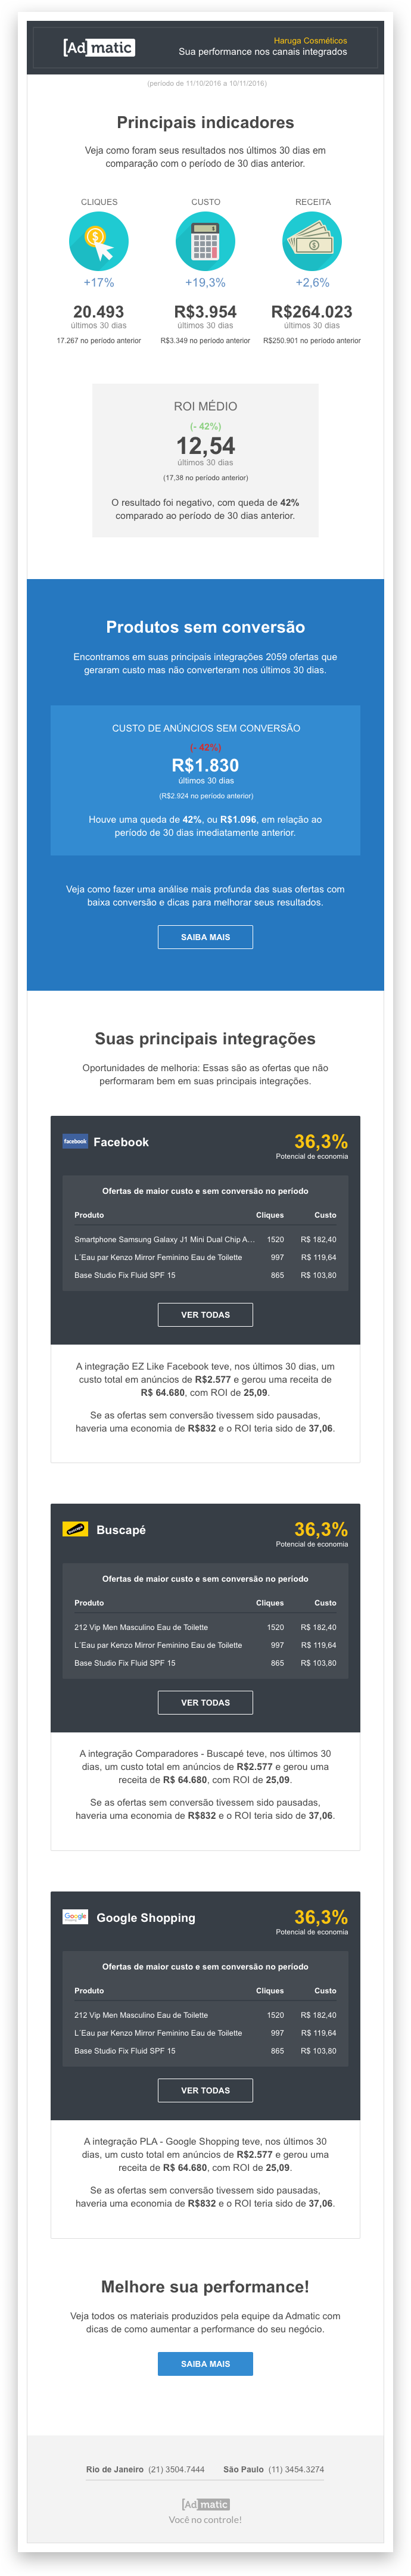
Agreed information to be included in the report
- Header with customer’s company name + branding
- Data extracted from the previous 30 days
- Main performance indicators (Clicks – Cost – Revenue) for the period & comparison with the same period in the previous year
- Average ROI for all integrations
- No conversion – Main products generating cost but not converting
- Main integrations – Same data on products not converting, broken down by the customer’s main integrations
- CTAs take the customer to the Admatic, filtered by context – General or by integration
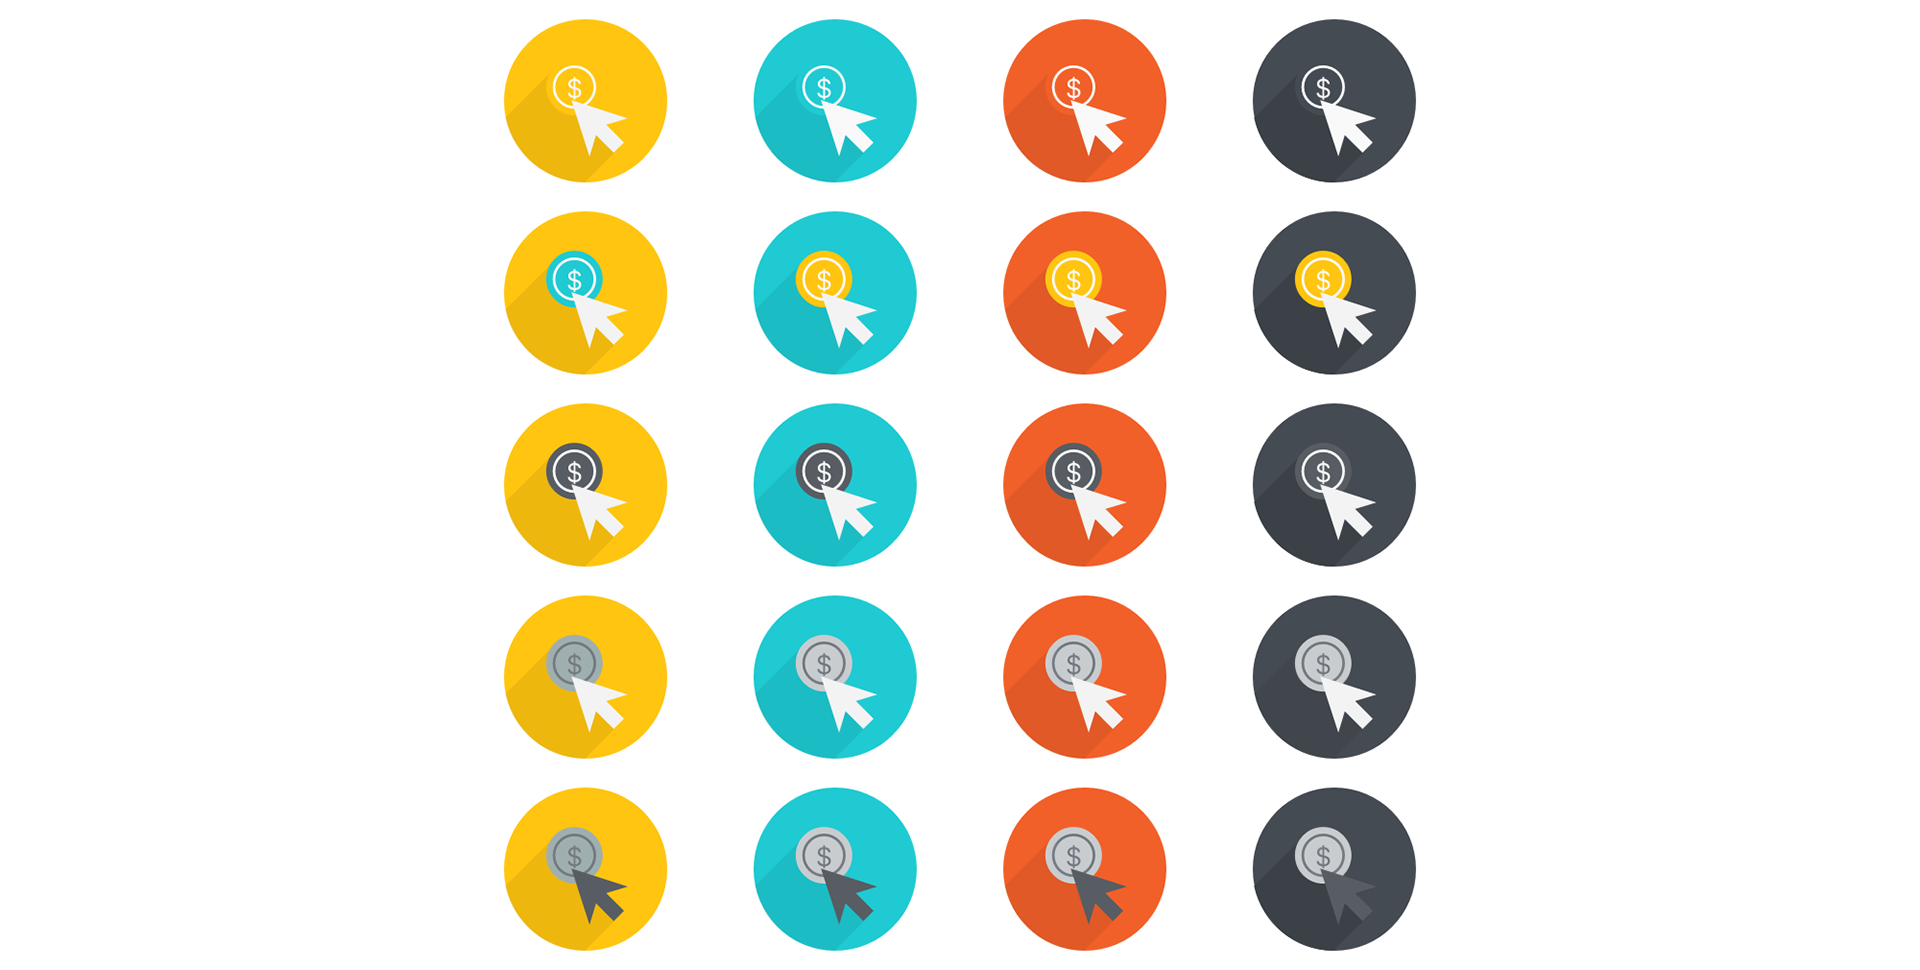
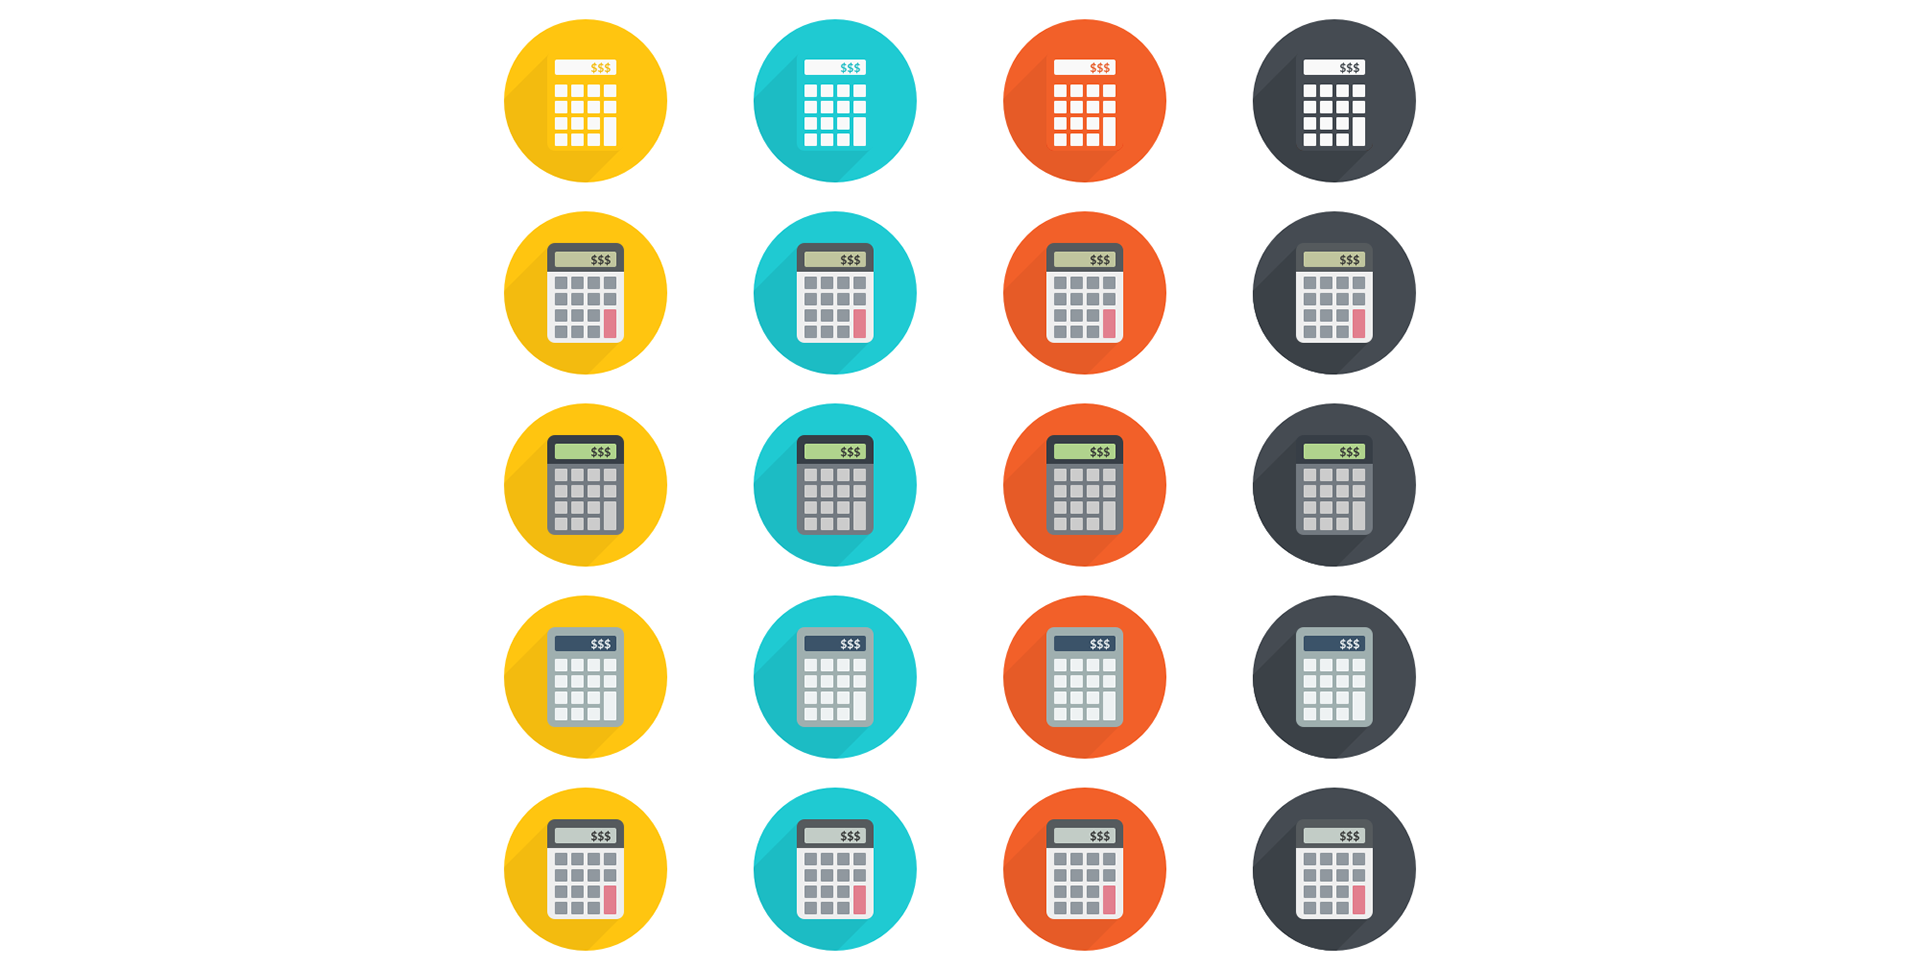
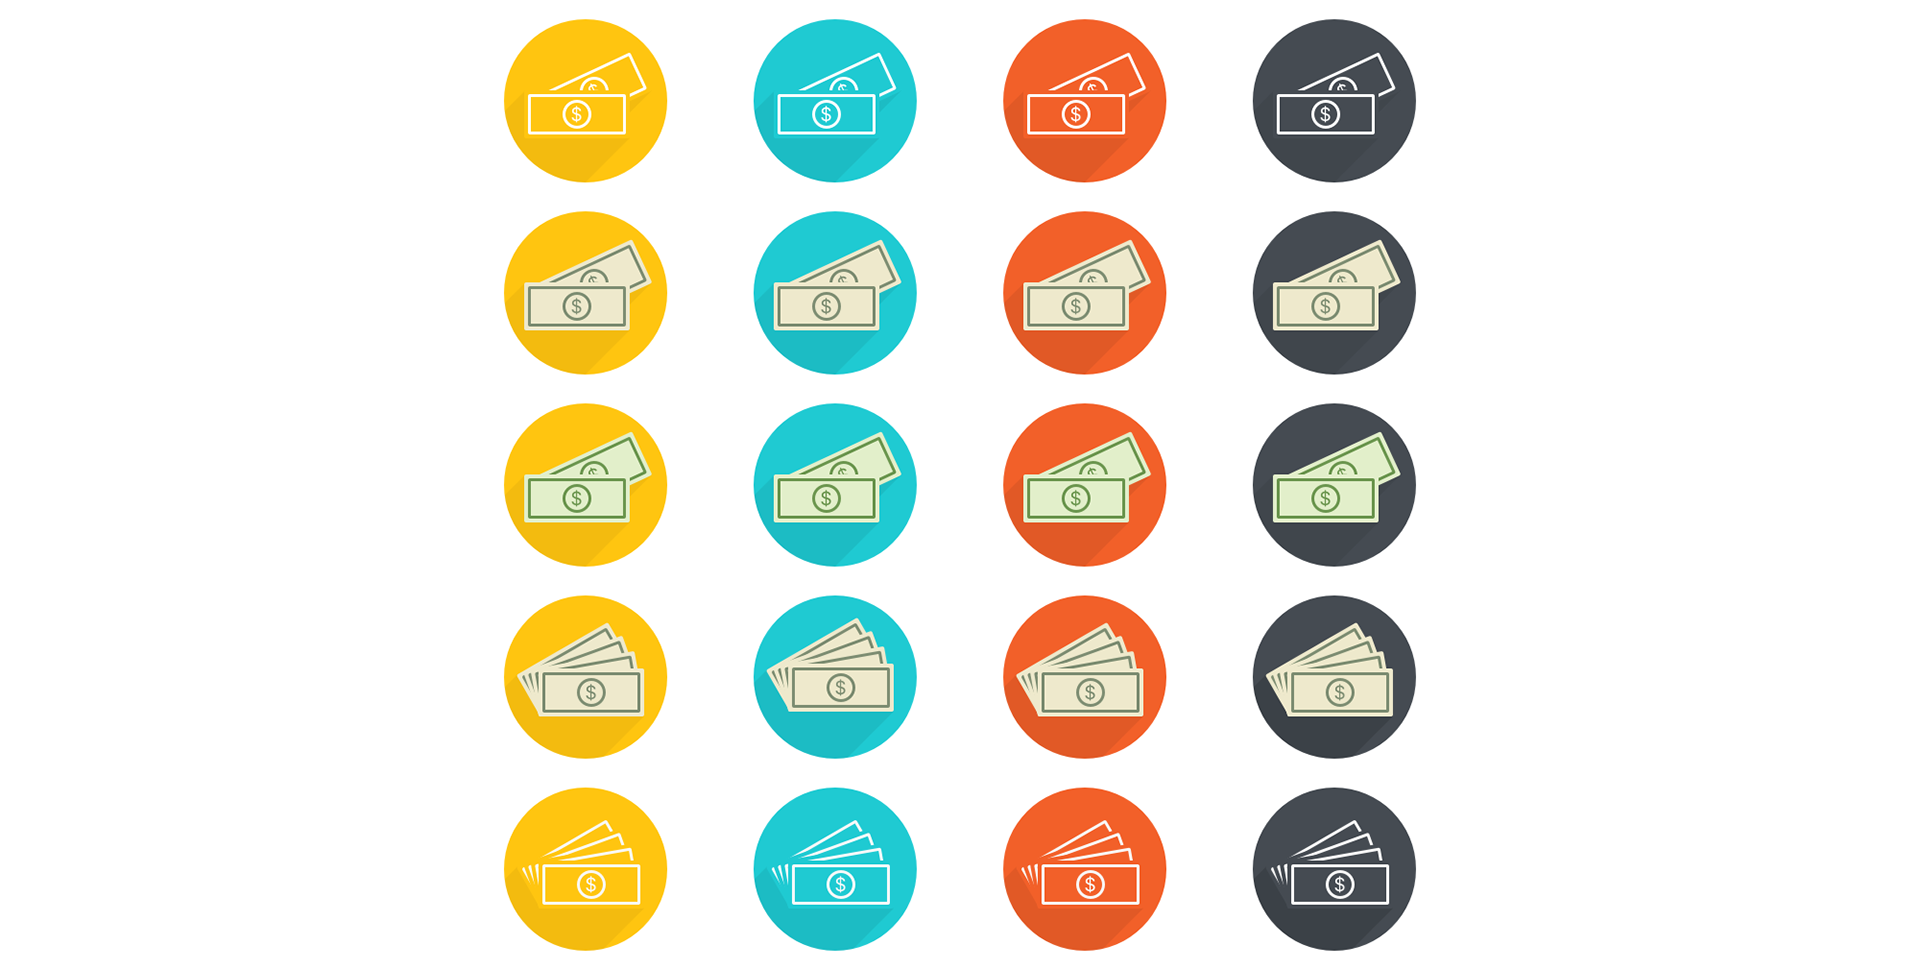
Iconography
Quick studies made following the design guidelines I have set in agreement with the managers for creating a more relatable and friendly communication with the customers.
Cliques (number of clicks on the ads for all channels)
Custo (total cost of the campaign)
Receita (total revenue in the period)
Final layout
The email’s layout was finished following the wireframes previously produced, with some fine adjustments, again for getting a more relatable communication.
- Dynamic textual summary of the data presented in each section of the report
- Link to the platform’s knowledge base with curated content related to performance improvements and automation of campaigns